Fishbone/Ishikawa Diagrams
Causelink supports Ishikawa/Fishbone diagrams (Fishbone diagrams), a tool commonly used within many organizations to brainstorm the potential causes of a problem.

Ishikawa Fishbone Diagrams
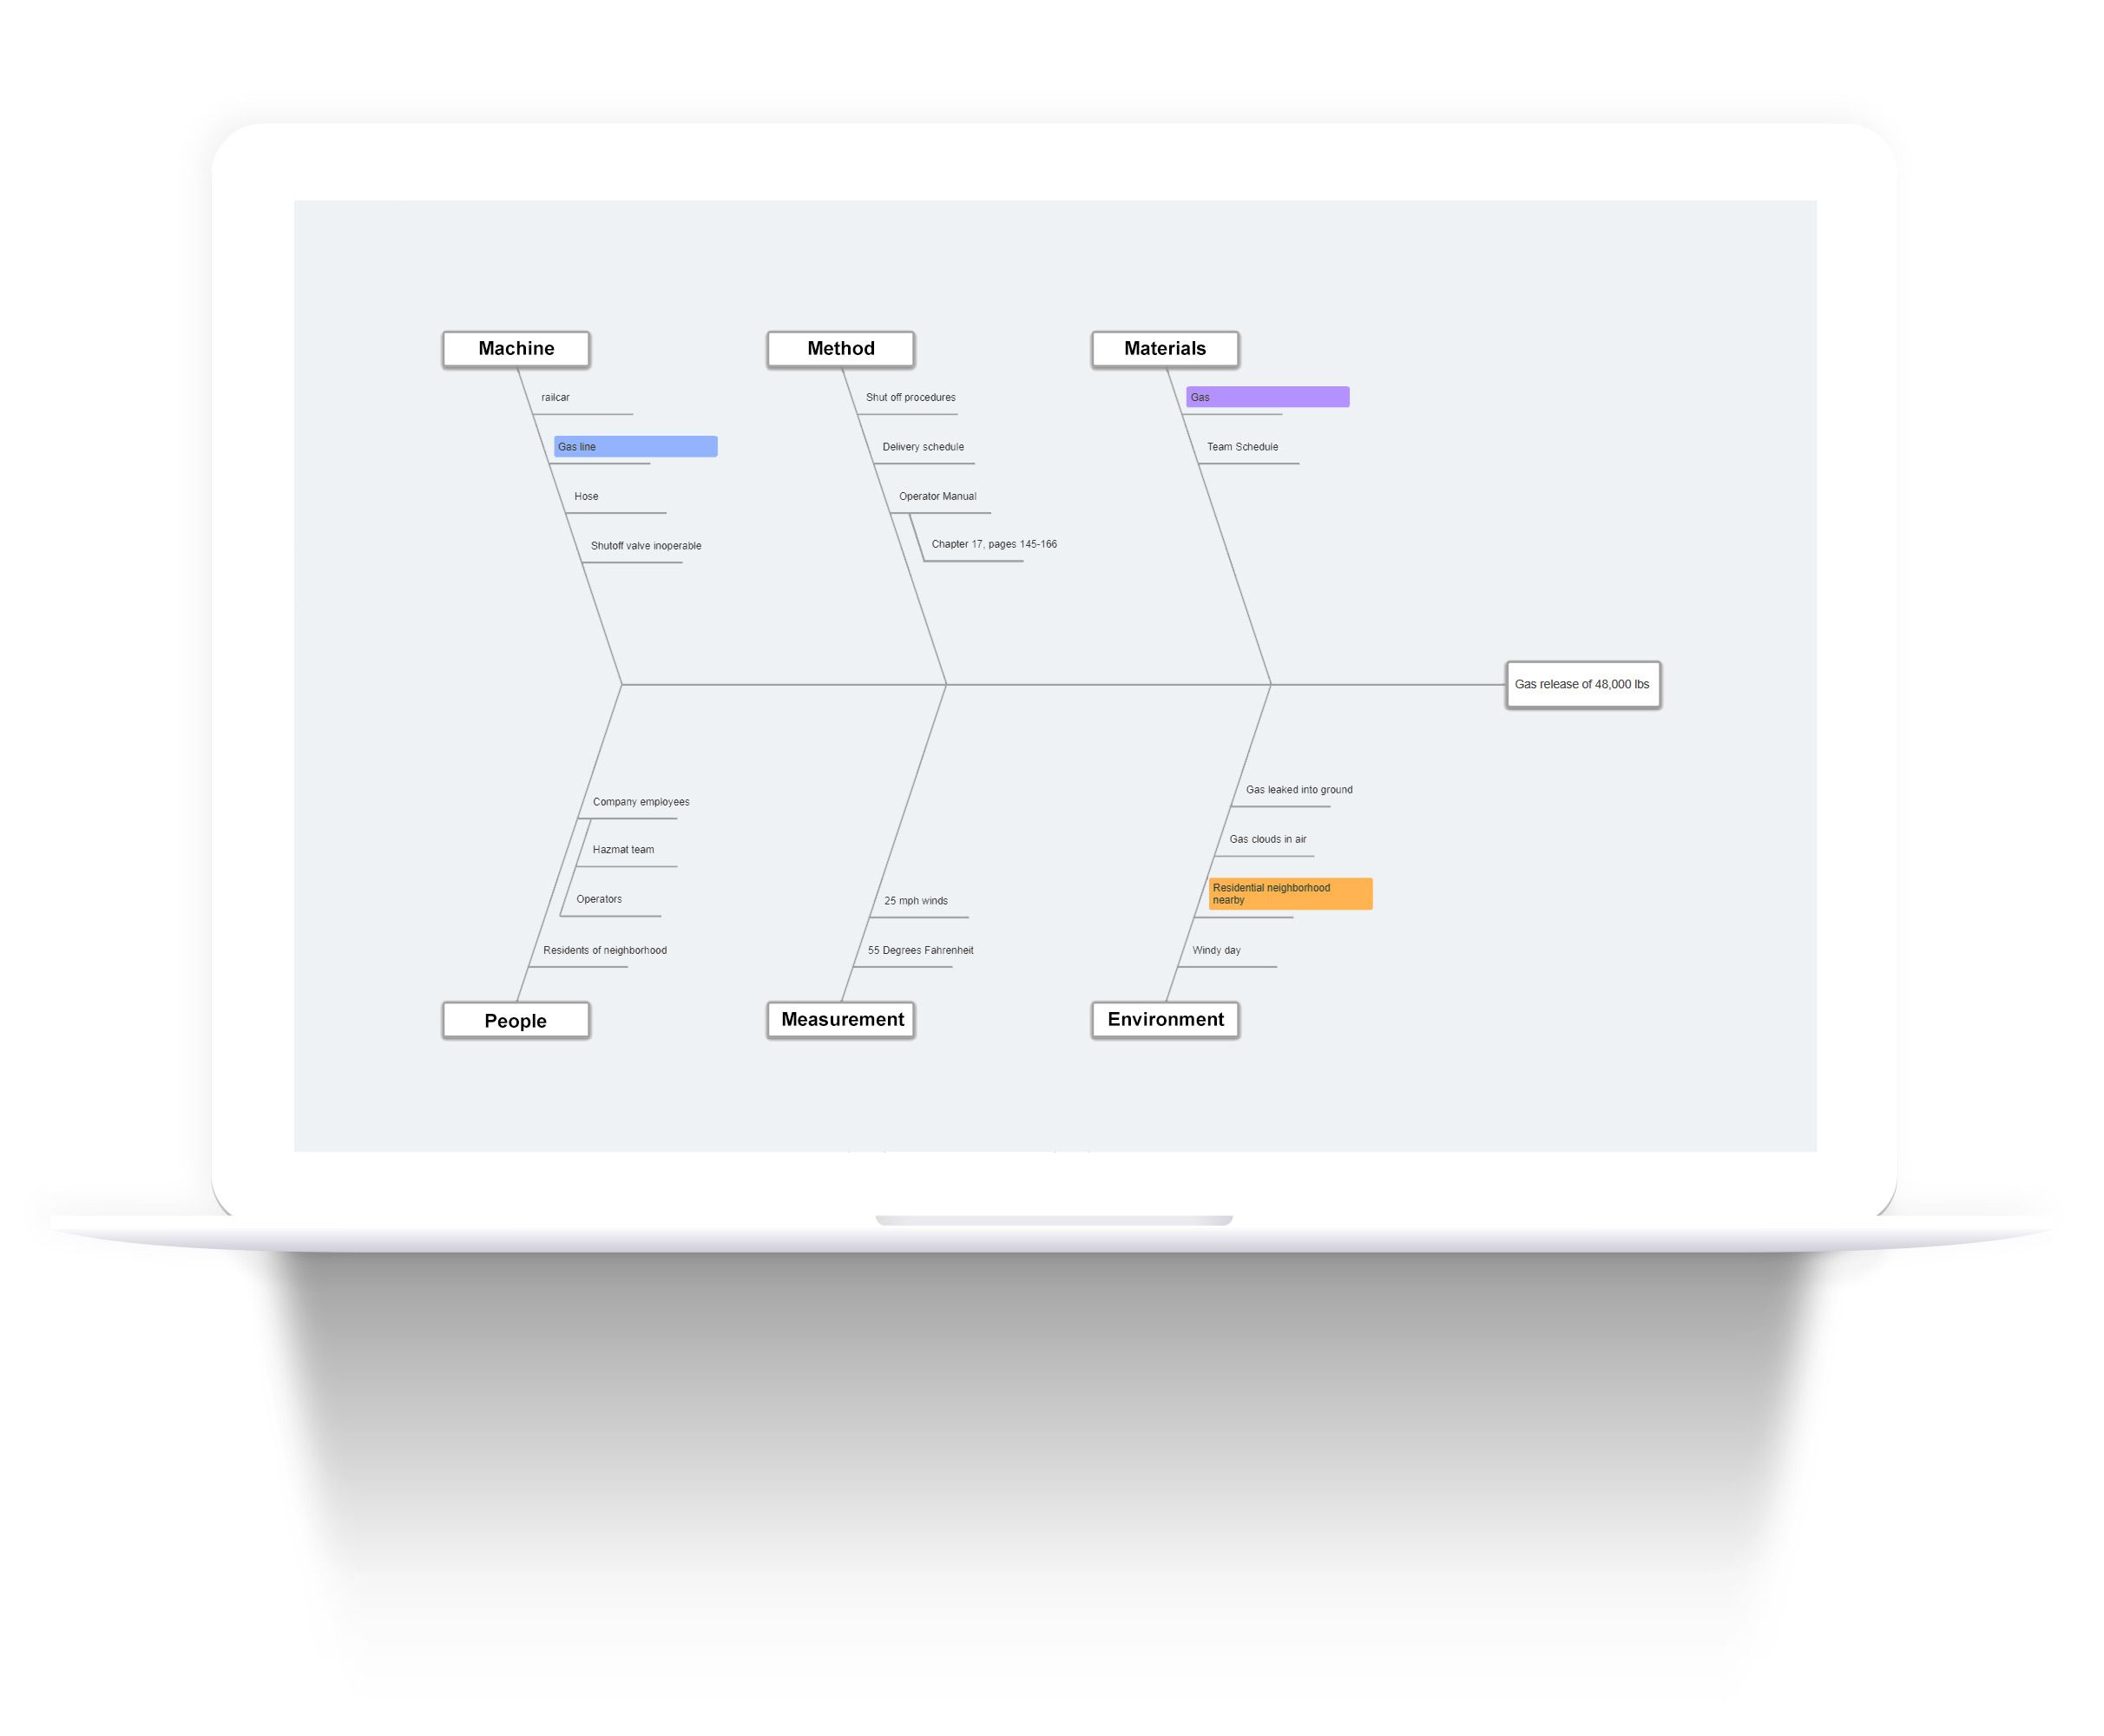
Ishikawa Fishbone Diagrams utilize the Logic of Sets to help organize causes and contributors to events. Starting with a standard set of high-level categories, users can brainstorm or arrange a taxonomy of potential contributors. Causelink provides full admin control over these initial high-level categories, allowing organizations to tailor the framework to their unique needs. Key features include:
- Each cause or contributor can be marked as Potential, Disproven, or Confirmed, enabling users to track and refine their analysis dynamically
- Evidence, Notes, Solutions, Tasks, Tags, and Attachments can be easily dragged and dropped into the diagram to provide rich context
- Drag-and-drop functionality allows for seamless adjustments of individual causes or entire branches
- Identified causes can be effortlessly converted into a Cause and Effect Logic Diagram for further analysis and exploration
- Simple interface makes it easy to structure and refine your understanding of complex events


